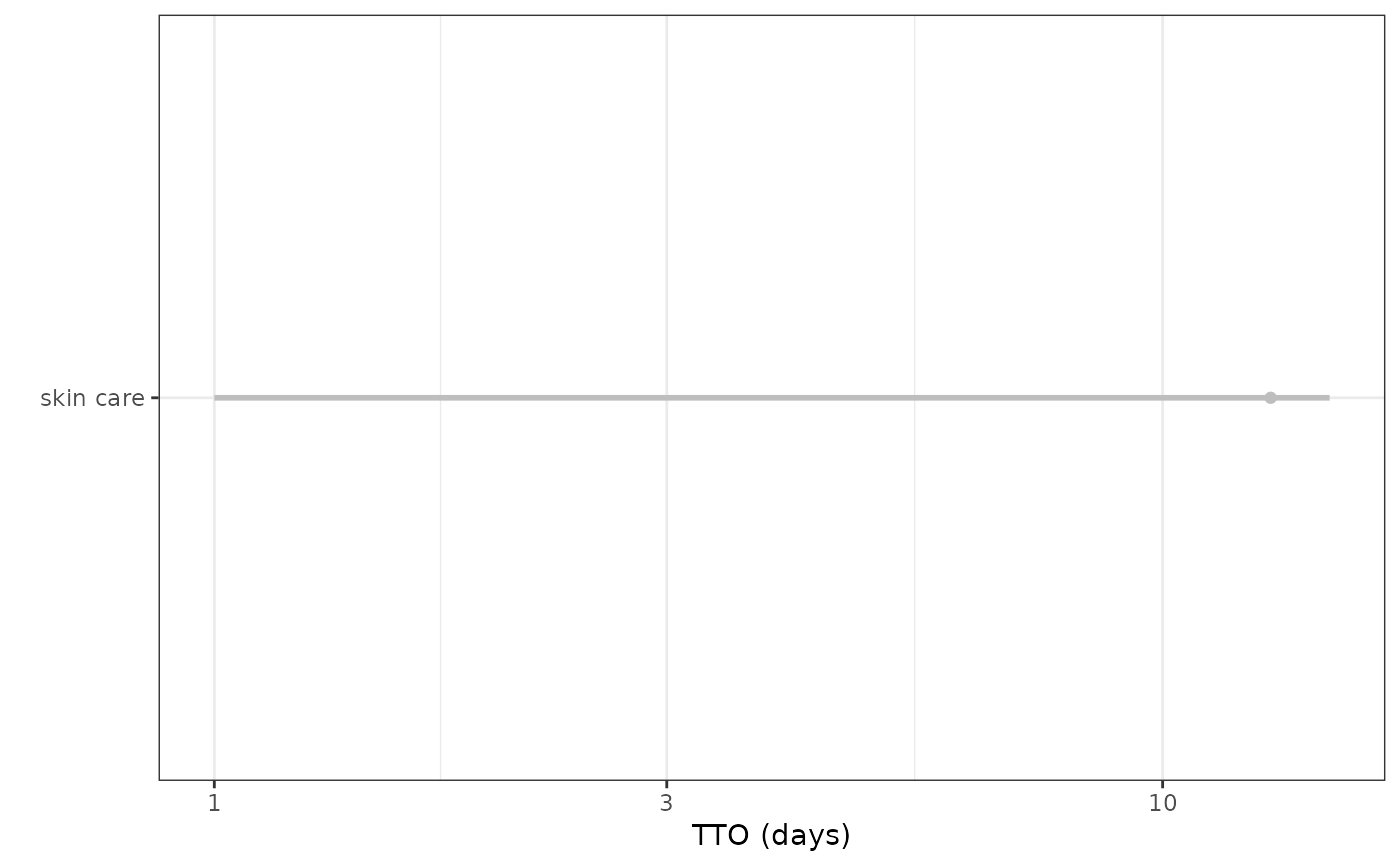
This function generates a forest plot visualization of time to onset analysis
Usage
render_tto(
  df,
  row = "substance",
  levs_row = NA,
  nested = FALSE,
  show_legend = TRUE,
  transformation = "log10",
  text_size_legend = 15,
  dodge = 0.3,
  nested_colors = NA,
  facet_v = NA,
  facet_h = NA
)
Arguments
- df
Data.table containing the data for rendering the forest plot.
- row
Variable for the rows of the forest plot (default is "substance").
- levs_row
Levels for the rows of the forest plot.
- nested
Variable indicating if nested plotting is required (default is FALSE). If nested plotting is required the name of the variable should replace FALSE.
- show_legend
Logical indicating whether to show the legend (default is FALSE).
- transformation
Transformation for the x-axis (default is "identity").
- text_size_legend
Size of text in the legend (default is 15).
- dodge
Position adjustment for dodging (default is 0.3).
- nested_colors
Vector of colors for plot elements.
- facet_v
Variable for vertical facetting (default is "NA", it could be setted to e.g., "event").
- facet_h
Variable for horizontal facetting (default is NA).
Examples
df <- time_to_onset_analysis(
  drug_selected = "skin care",
  reac_selected = list("skin affection" = list(
    "dry skin",
    "skin burning sensation",
    "skin irritation",
    "erythema",
    "rash macular",
    "acne",
    "skin haemorrhage"
  )),
  temp_drug = sample_Drug, temp_reac = sample_Reac,
  temp_ther = sample_Ther
)
render_tto(df)

