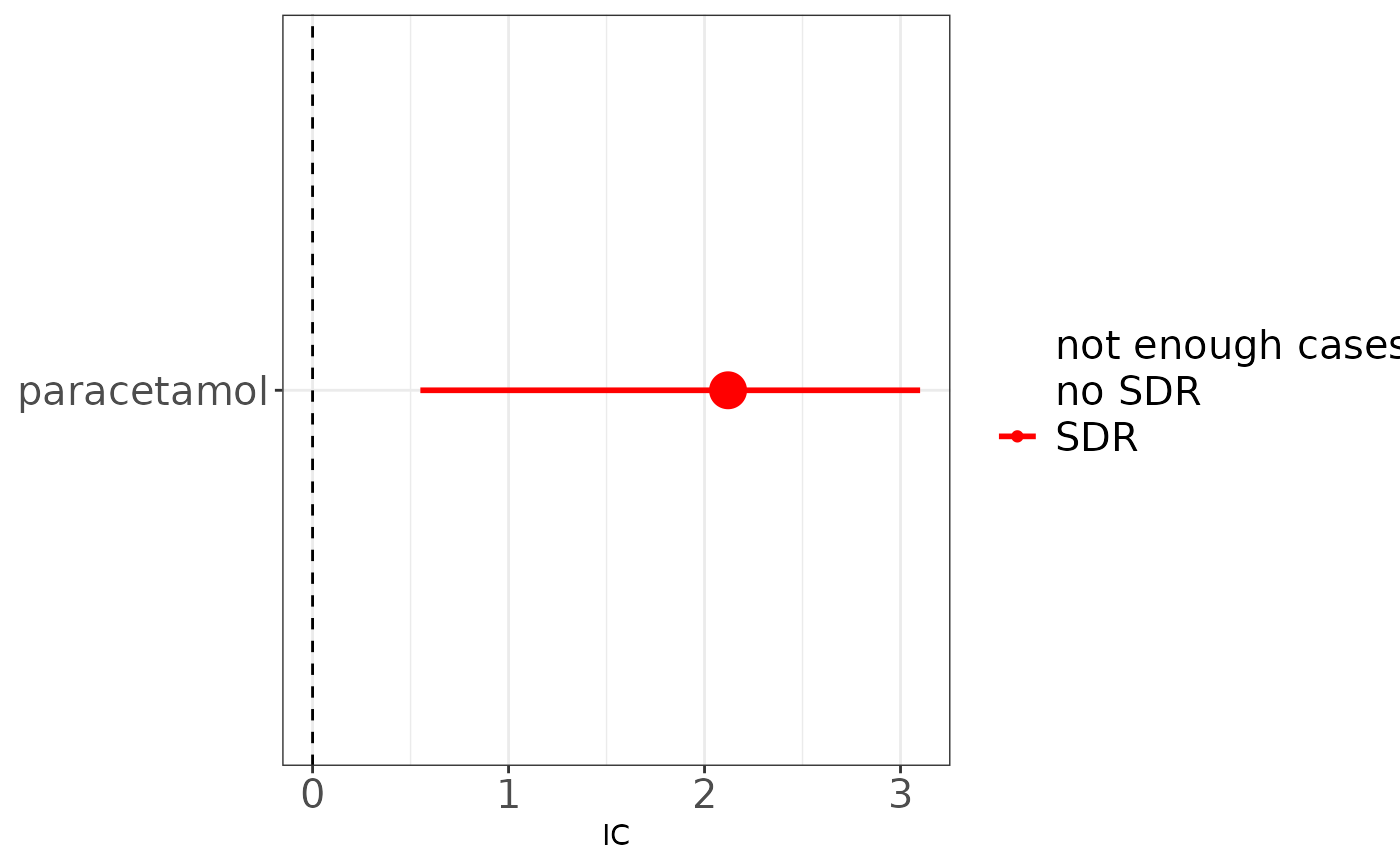
This function generates a forest plot visualization of disproportions
visualizing the results of disproportionality_analysis().
Usage
render_forest(
  disproportionality_df,
  index = "IC",
  row = "substance",
  levs_row = NA,
  nested = FALSE,
  show_legend = TRUE,
  transformation = "identity",
  custom_threshold = NA,
  text_size_legend = 15,
  text_size_axis = 15,
  text_size_strip = 15,
  dodge = 0.3,
  nested_colors = NA,
  facet_v = NA,
  facet_h = NA,
  legend_position = "right",
  point_size = 0,
  xcoord_lims = NA
)
Arguments
- disproportionality_df
A data frame containing disproportionality metrics. Generated by disproportionality_analysis.
- index
Type of data to use for rendering: "ROR" or "IC".
- row
Variable for the rows of the forest plot (default is "drug").
- levs_row
Levels for the rows of the forest plot.
- nested
Variable indicating if nested plotting is required (default is FALSE). If nested plotting is required the name of the variable should replace FALSE.
- show_legend
Logical indicating whether to show the legend (default is FALSE).
- transformation
Transformation for the x-axis (default is "identity").
- custom_threshold
Threshold value for analysis (default is 1).
- text_size_legend
Size of text in the legend (default is 15).
- text_size_axis
Size of text in the axes (default is 15).
- text_size_strip
Size of text in the axes (default is 15).
- dodge
Position adjustment for dodging (default is 0.3).
- nested_colors
Vector of colors for plot elements.
- facet_v
Variable for vertical facetting (default is "event").
- facet_h
Variable for horizontal facetting (default is NA).
- legend_position
Where to place the legend.
- point_size
Numeric defining the size of the points, between 0 and 10. Default to 0 scales the size with the log10 of the count of observed.
- xcoord_lims
Parameter to cut the IC axis. Defaults to NA for auto-setting. It should be in the format c(xmin,xmax)
See also
Other visualization functions:
plot_disproportionality_trend()
Examples
disproportionality_df <- disproportionality_analysis(
  drug_selected = "paracetamol",
  reac_selected = "overdose",
  temp_drug = sample_Drug,
  temp_reac = sample_Reac
)

render_forest(disproportionality_df)

